
A conversation about using browser Developer tools to validate NSX API’s for quick troubleshooting in some cases.
CuriousTechie: Hello IT Guy, I am planning to upgrade my NSX but I see a problem with the upgrade status in UI and not sure where to start the troubleshoot process.
ITGuy: Okay sure! Let’s take a look at the problem then we can get some clue to move ahead.
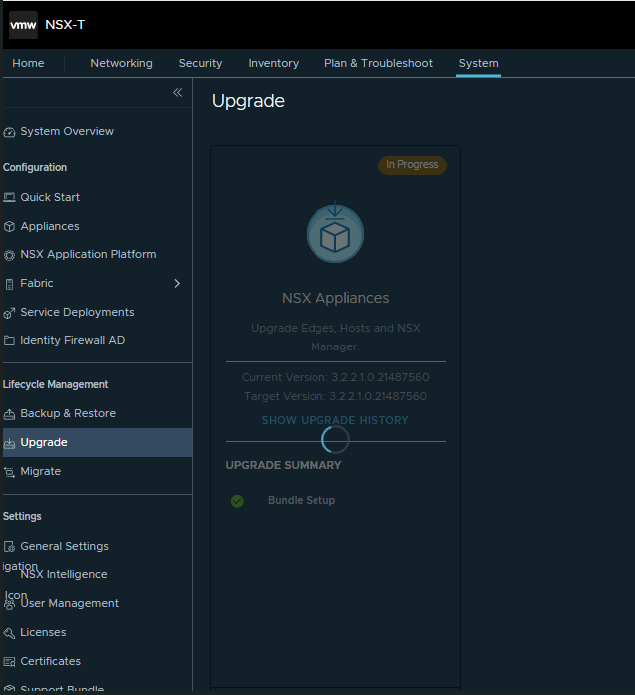
CuriousTechie: My upgrade screen is stuck like this.
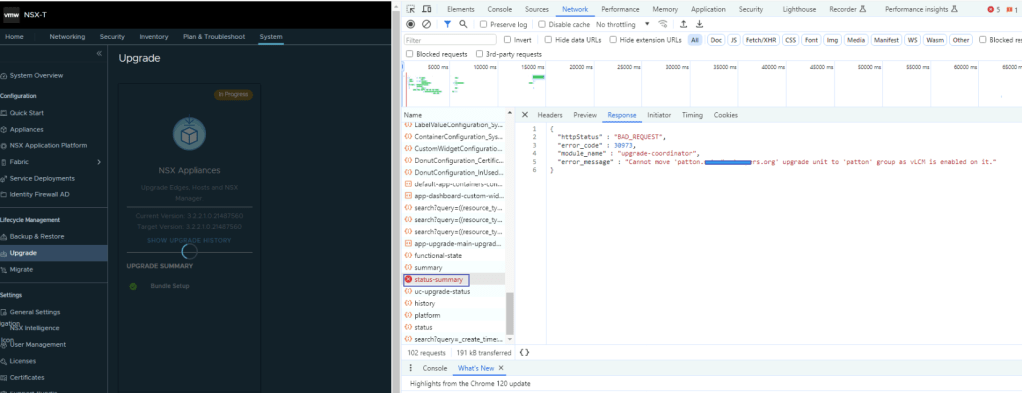
ITGuy: Checking logs is the most logical step for troubleshooting. But in this instance, since you see the error directly on the UI and know that whatever action you perform in the NSX UI actually triggers API calls in the backend, the easiest way to monitor these API calls is to use the Developer tool of your browser. You can usually find it under the browser’s More Tools -> Developer Tools -> Network tab, or use the shortcut (Ctrl+Shift+I). I would recommend opening the Developer tools and inspecting the API call that is failing. This often provides me with a good starting point for resolving issues that are visible in the NSX UI.
CuriousTechie: Interesting!! I have never thought of it, let me give it a try right away.
ITGuy: Now you got a point to start, but let’s also take a look at the logs “/var/log/upgrade-coordinator” to check if it has a similar error or not.
CuriousTechie: Okay sure!
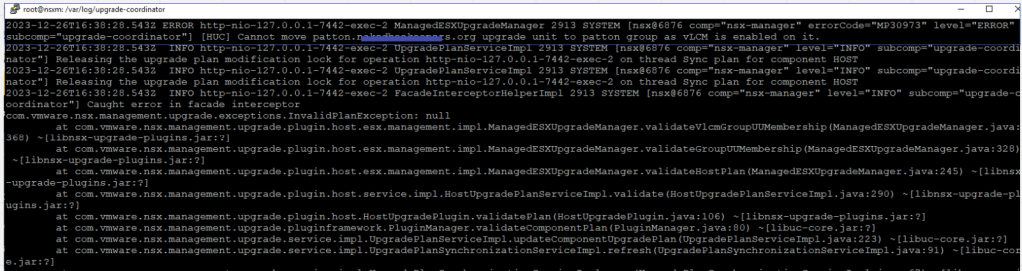
ITGuy: Perfect! You can see the same ERROR in the logs that you saw on the Developer tools API call. Now you can troubleshoot further on it and let me know how it goes.
CuriousTechie: Sure! Thanks!
