

In this short conversation we will talk about monitoring the operations of a vDefend Distributed Firewall implementation.
CuriousTechie: Hello IT Guy! We had a conversation about implementing micro-segmentation here. I began implementing micro-segmentation in our VMware Software Defined Data Center(SDDC) environment using vDefend Distributed Firewall. Multiple engineers work simultaneously to implement the rules and secure their respective applications. I am looking for a way to audit these operations to detect any unintended rule creation, modification or deletion. Can you help me with some pointers to monitor these activities?
ITGuy: In my honest opinion, logs are your best friend when you want to monitor DFW operations. You can very well customize what you want to monitor and how? You can choose dashboards for certain activities and alerts for critical activities.
CuriousTechie: What tools will I need to build these dashboards and alerts?
ITGuy: Some very common ones are vRealize LogInsight aka Aria Operation for Logs here, Splunk here etc. You can use any other log aggregator of your choice to do this.
CuriousTechie: Where can I configure the log forwarding?
ITGuy: All the components of NSX generates logs, which can be forwarded to any log aggregator. You must configure your esxi hosts (Host Transport Nodes) to forward logs and also enable logging on the rule. This is necessary if you would like to monitor the Packet logs passing through DFW dvfilter.

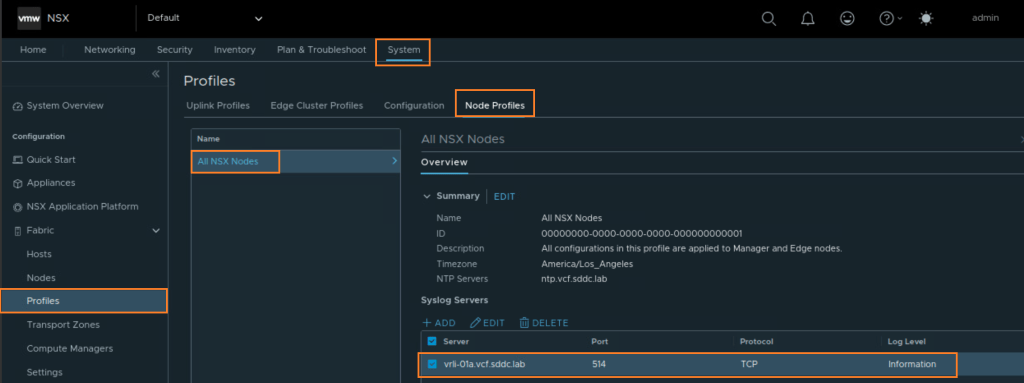
Similarly, you must configure your NSX managers to forward logs. This is essential if you would like to monitor configuration level activities done on the management plane i.e NSX manager. You can configure logging in the NSX manager UI.
Navigate to System -> Fabric -> Profiles -> Node Profiles – > All NSX Nodes -> Syslog Servers. Make sure to select the Log Level as “Information” if you want the Audit logs to be forwarded to your logging endpoint.
CuriousTechie: What will be some important activities I can monitor and how can I build the alarms for it?
ITGuy: A good place to start is monitoring of rules where the AppliedTo field is configured as DFW .These rules gets pushed to every vnic in the environment and should be used for Infrastructure or environment rules. As a best practice, application rules must always be applied on an application specific security group.
CuriousTechie: Can you help me with a sample dashboard and query to look for these changes?
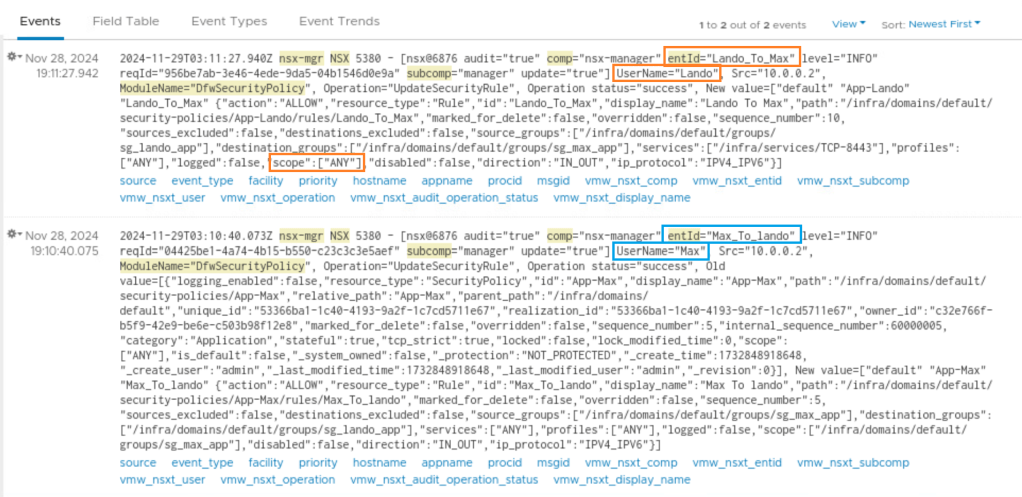
ITGuy: Sure! As a sample, you can create dashboards like these to visualize operational activities for Rule creations. Below dashboard shows a bar( 1 log entry) for a new rule where AppliedTo field is set to DFW.

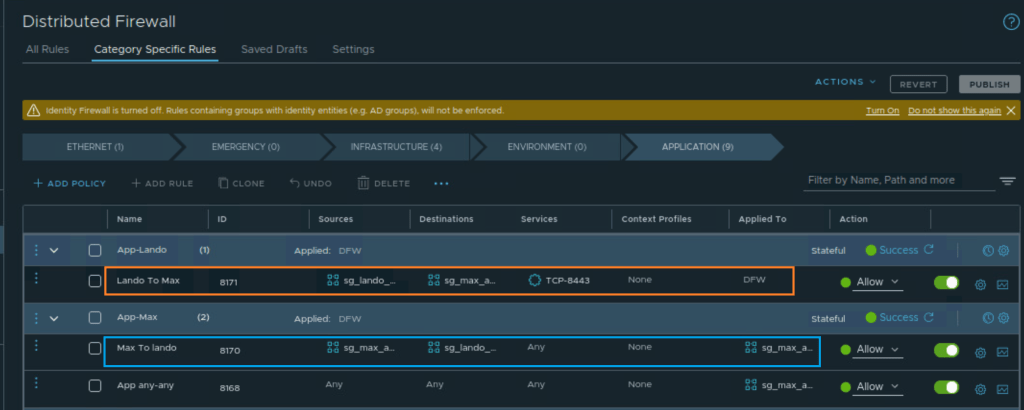
Exploring the logs from the dashboard you can check what activity was performed and by whom. Checking the logs, it seems that user Lando created a rule “Lando To Max.” The AppliedTo field was not set to a Security Group. It was left as DFW scope[ANY] which may not be the intended purpose of the rule.
We can now validate the same in the NSX manager UI and take corrective steps if required.
Here is a sample LogInsight query for these dashboards.

ITGuy: You may need to tune the query as per your environment needs and implementation practices. You can separate dashboards for multiple environments. Different dashboards for different operations like create, update, delete. You can use these queries to generate alerts if a log hit happens. The goal of this sample query is to provide a starting point for monitoring DFW activities via log monitoring.
CuriousTechie: This is very informative, I will try to build these dashboards and alerts for my DFW implementation.
ITGuy: Absolutely! Audit of operations play a critical role in any IT environment. It will help in Compliance Assurance and also to maintain Operational Efficiency.
